Monitoring Webstes with ELK
ELK Stack, also known as Elasticsearch, Logstash, and Kibana is a powerful open source log capture, search, and visualization solution. ELK is offered in free open source solutions or paid hosted solutions. AWS has a similar service called AWS Elasticsearch.
What makes up the components for an ELK Stack? First, let’s start off with Logstash. Logstash is an open source logging tool that can ingest logs from many different sources and formats such as Apache, syslog CSV, JSON, and much more. After processing the logs, Logstash sends the data to Elasticsearch where the data can be quickly searched. Kibana allows users to visualize and graph the data from Elasticsearch.
Setting up an ELK Stack
Setting up an ELK Stack can be challenging and require a fair amount of resources depending on the amount of data, search, and visualization requirements. For my purposes, I decided to run ELK on my older iMac system since I only want to analyze Apache logs, fail2ban, and syslog for my web stack. Best place to start to deploy ELK in your platform is https://www.elastic.co/guide/en/elastic-stack-get-started/current/get-started-elastic-stack.html.
Analyzing Apache Logs
For websites that I manage, I send the Apache logs to AWS S3 in compressed format. I do this for several reasons, cheaper storage, deep archive, and agility to work with the data with other services and tools. This fits nicely into the ELK architecture.
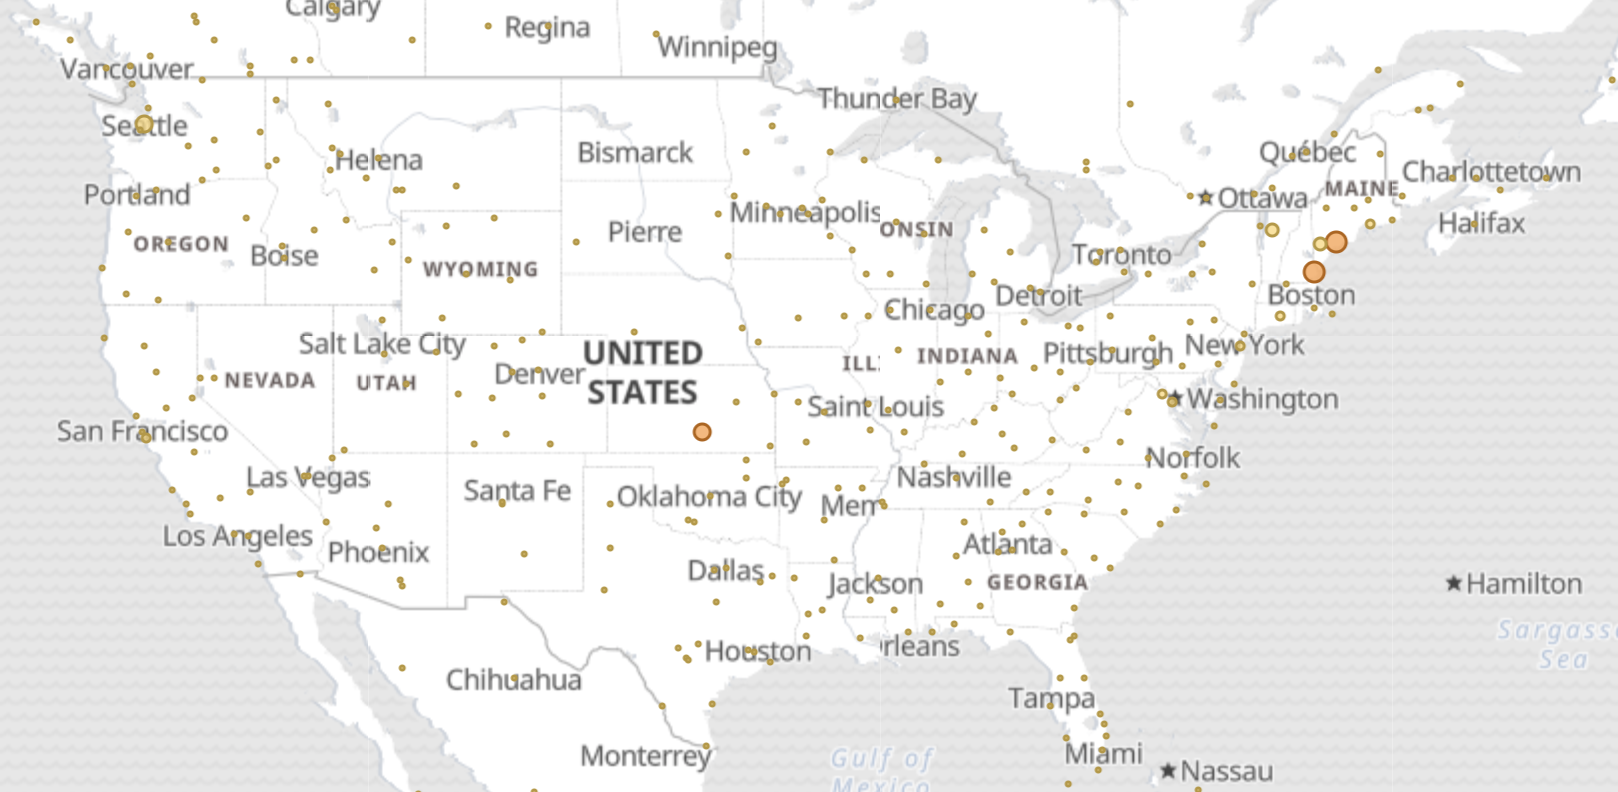
By putting Apache data into ELK, I can quickly search and filter for errors, suspicious activity, and content. Visually, I can see any anomalies that occur on any of the sites. Creating charts and graphs on all the data collected and utilizing the geoip, visitors can be visualized on a world heat map.
Below is the logstash.conf that I created to ingest Apache logs from S3 and send them to Elasticsearch
1
2
3
4
5
6
7
8
9
10
11
12
13
14
15
16
17
18
19
20
21
22
23
24
25
26
27
28
29
30
31
32
33
34
35
36
37
38
39
40
41
42
43
44
45
46
47
48
49
50
51
52
53
54
55
56
57
58
59
60
61
62
63
64
65
66
67
68
69
70
71
72
73
74
75
76
77
input {
   s3 {
     "access_key_id" => "[key]"
     "secret_access_key" => "[key]"
     "region" => "[region]"
     "bucket" => "[S3 bucket]"
     "prefix" => "[S3 prefix]"
     type => "[sitename1]"
   }
   s3 {
   "access_key_id" => "[key]"
   "secret_access_key" => "[key]"
   "region" => "[region]"
   "bucket" => "[S3 bucket]"
   "prefix" => "[S3 prefix]"
   type => "[sitename2]"
   }
   s3 {
   "access_key_id" => "[key]"
   "secret_access_key" => "[key]"
   "region" => "[region]"
   "bucket" => "[S3 bucket]"
   "prefix" => "[S3 prefix]"
   type => "[sitename3]"
   }
 }
 filter {
       grok {
          match => [
          "message" , "%{COMBINEDAPACHELOG}+%{GREEDYDATA:extra_fields}",
          "message" , "%{COMMONAPACHELOG}+%{GREEDYDATA:extra_fields}"
          ]
          overwrite => [ "message" ]
       }
       if [type] == "sitename1" {
         mutate {
          convert => ["response", "integer"]
          convert => ["bytes", "integer"]
          convert => ["responsetime", "float"]
          add_field => { "website" => "website name 1" }
         }
       }
       if [type] == "sitename2" {
         mutate {
          convert => ["response", "integer"]
          convert => ["bytes", "integer"]
          convert => ["responsetime", "float"]
          add_field => { "website" => "website name 2" }
         }
       }
       if [type] == "sitename3" {
         mutate {
          convert => ["response", "integer"]
          convert => ["bytes", "integer"]
          convert => ["responsetime", "float"]
          add_field => { "website" => "website name 3" }
         }
       }
       geoip {
          source => "clientip"
          target => "geoip"
          add_tag => [ "apache-geoip" ]
       }
       date {
          match => [ "timestamp" , "dd/MMM/YYYY:HH:mm:ss Z" ]
          remove_field => [ "timestamp" ]
       }
       useragent {
          source => "agent"
       }
 }
 output {
   elasticsearch {
     hosts => ["localhost:9200"]
     index => "logstash-%{+YYYY.MM.dd}"
   }
 }
First, let’s start with the input section. I highly recommend that you create AWS access keys with least privilege security to the buckets where your logs reside. Enter in the region, bucket, and prefix information. I’m using type to split out each of the sites to tag them in Elasticsearch so I can filter them later.
1
2
3
4
5
6
7
8
9
10
11
12
13
14
15
16
17
18
19
20
21
22
23
24
25
26
input {
   s3 {
     "access_key_id" => "[key]"
     "secret_access_key" => "[key]"
     "region" => "[region]"
     "bucket" => "[S3 bucket]"
     "prefix" => "[S3 prefix]"
     type => "[sitename1]"
   }
   s3 {
   "access_key_id" => "[key]"
   "secret_access_key" => "[key]"
   "region" => "[region]"
   "bucket" => "[S3 bucket]"
   "prefix" => "[S3 prefix]"
   type => "[sitename2]"
   }
   s3 {
   "access_key_id" => "[key]"
   "secret_access_key" => "[key]"
   "region" => "[region]"
   "bucket" => "[S3 bucket]"
   "prefix" => "[S3 prefix]"
   type => "[sitename3]"
   }
 }
Next is the filer section of the configuration file. The grok code helps to parse and break up the data to be ingested. For each site, I’m converting some types and adding a file for the site so it can be tagged for later searching and filtering. The last important piece is setting up geoip so I can use this data to visualize visitor locations on a map.
1
2
3
4
5
6
7
8
9
10
11
12
13
14
15
16
17
18
19
20
21
22
23
24
25
26
27
28
29
30
31
32
33
34
35
36
37
38
39
40
41
42
43
44
45
filter {
       grok {
          match => [
          "message" , "%{COMBINEDAPACHELOG}+%{GREEDYDATA:extra_fields}",
          "message" , "%{COMMONAPACHELOG}+%{GREEDYDATA:extra_fields}"
          ]
          overwrite => [ "message" ]
       }
       if [type] == "sitename1" {
         mutate {
          convert => ["response", "integer"]
          convert => ["bytes", "integer"]
          convert => ["responsetime", "float"]
          add_field => { "website" => "website name 1" }
         }
       }
       if [type] == "sitename2" {
         mutate {
          convert => ["response", "integer"]
          convert => ["bytes", "integer"]
          convert => ["responsetime", "float"]
          add_field => { "website" => "website name 2" }
         }
       }
       if [type] == "sitename3" {
         mutate {
          convert => ["response", "integer"]
          convert => ["bytes", "integer"]
          convert => ["responsetime", "float"]
          add_field => { "website" => "website name 3" }
         }
       }
       geoip {
          source => "clientip"
          target => "geoip"
          add_tag => [ "apache-geoip" ]
       }
       date {
          match => [ "timestamp" , "dd/MMM/YYYY:HH:mm:ss Z" ]
          remove_field => [ "timestamp" ]
       }
       useragent {
          source => "agent"
       }
 }
Last, section handles sending the output to the Elasticsearch host, which in this case is local.
1
2
3
4
5
6
 output {
   elasticsearch {
     hosts => ["localhost:9200"]
     index => "logstash-%{+YYYY.MM.dd}"
   }
 }
What does this look like in Kibana?
Once in the data is in Elasticsearch, you will want to jump into Kibana to create charts and graphs of the data. For starters, I created views based on the various websites and filter our data that I am not interested in. What’s left is a view that I can zoom in and out based on timeline. 
Daily summary of website hits
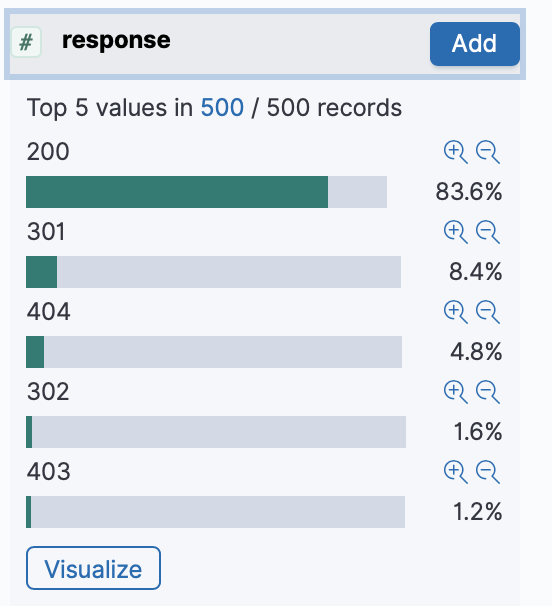
Using that same data, I created a coordinated map dashboard using a coordinated world map to show where visits are coming from.  Another example of what you can use Kibana for is to visualize data such as HTTP Responses for 200, 301 and 404. Within the search itself, you can quickly filter on responses 404 to further analyze website for issues.
Next steps
With this blog post, I only scratched the surface of what you can do with ELK to monitor your websites. Next up for me is to explore sending syslog, fail2ban, and other data into the ELK stack.
